The Average Is Lying to You
Published


Ask "what's the latency?" in an interview and the instinctive answer is an average. It's the wrong number to design around, because it hides exactly the users who are having a bad time - and at real scale, "rare" stops meaning what you think it means.
What p50 and p99 actually mean
A percentile answers one question: of all the requests you measured, what fraction were faster than a given value? P50 (the median) means half of requests were faster than that number, and half were slower. P95 means 95% of requests were faster, and the worst 5% were slower. P99 means 99% were faster - and the 1% you don't see in a "typical" summary were slower, sometimes much slower.
That's the whole difference between a percentile and an average. An average blends every request into a single number and lets the fast ones cancel out the slow ones. A percentile refuses to blend - it tells you directly what the bad end of the distribution looks like, which is exactly the part an average is built to hide.
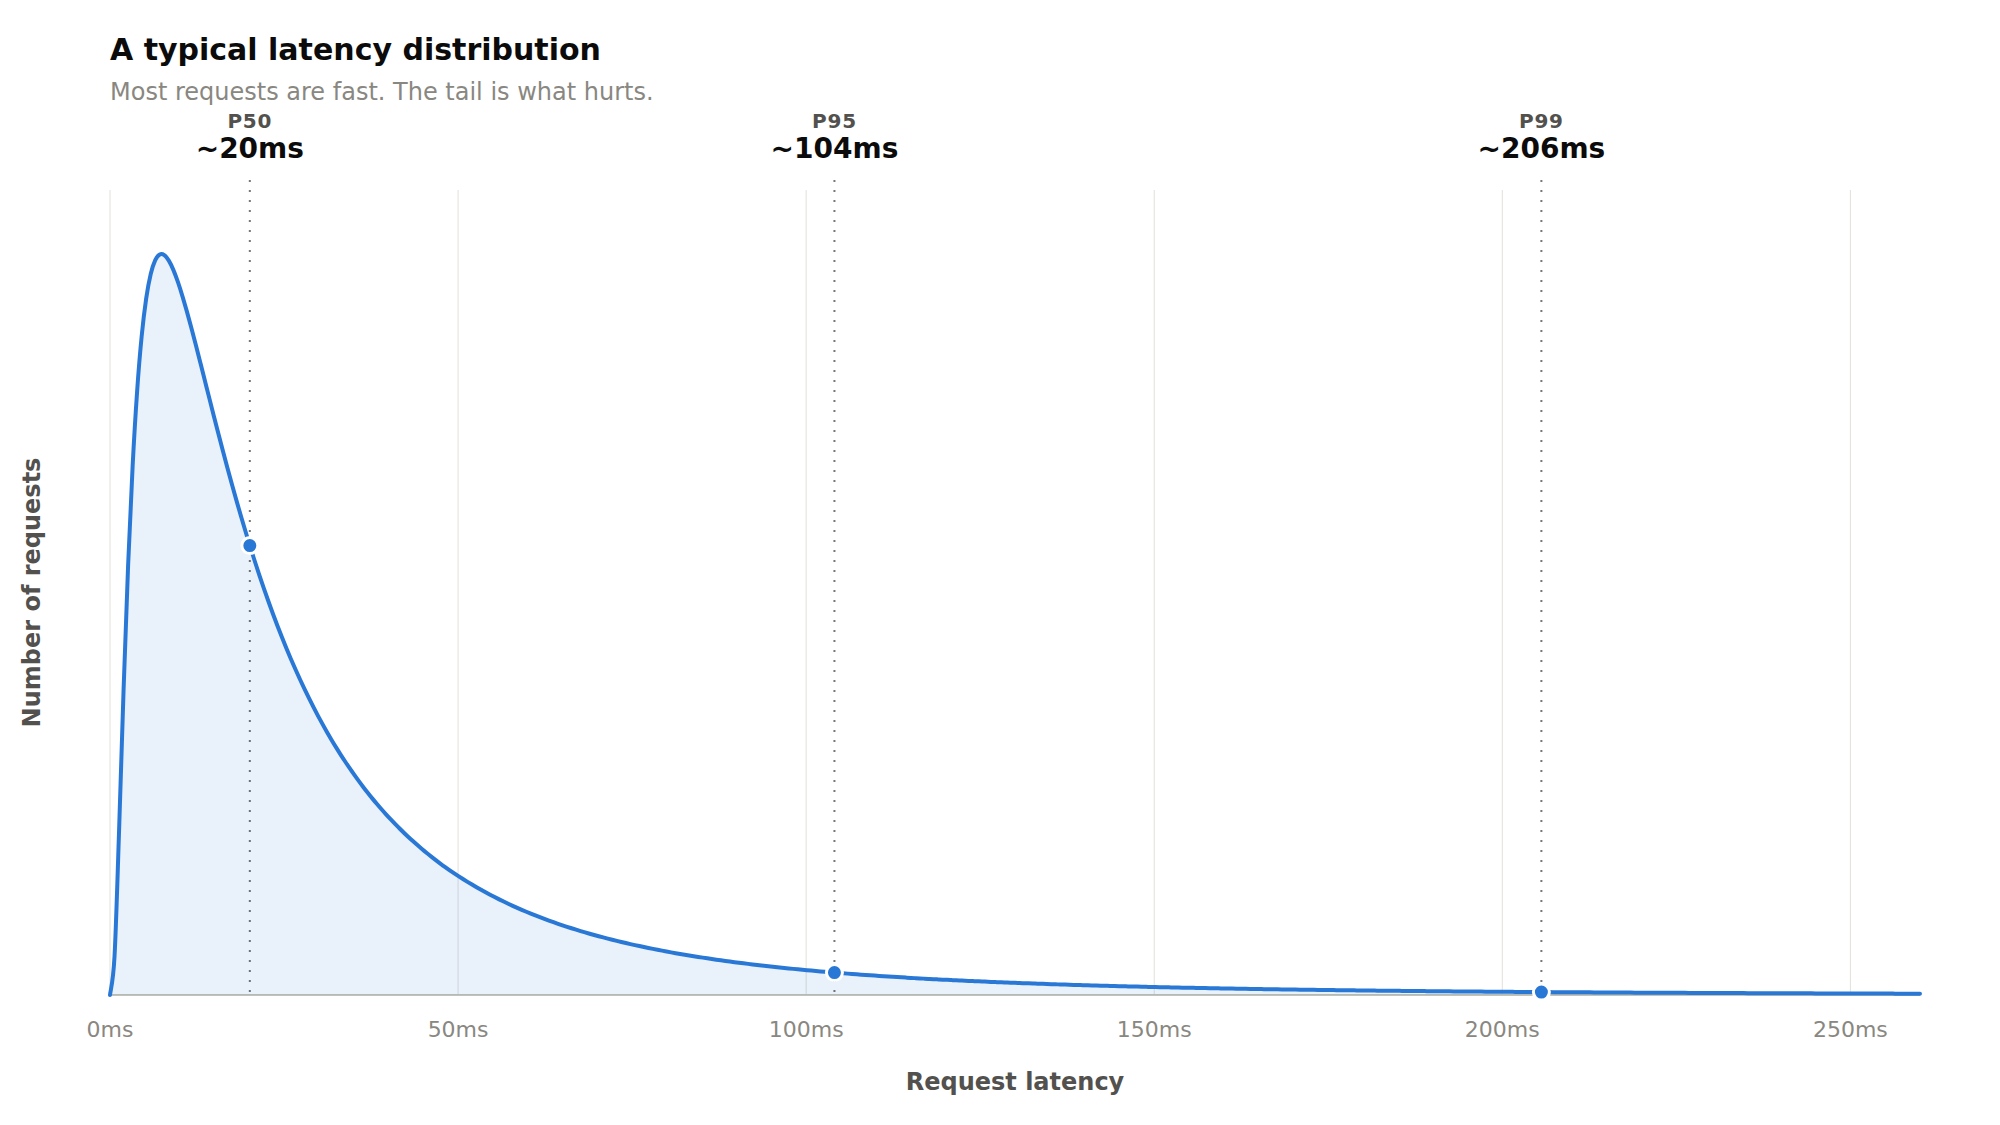
Most real latency distributions look like the chart above: a sharp peak of fast requests, then a long right-hand tail of slower ones. The mean gets pulled toward that tail without ever describing it, which is why two systems with the same average latency can feel completely different to use - one has a short tail, the other doesn't.
Why the tail matters more than it sounds like it should
Say a single user-facing request fans out to 100 backend calls, and each one has a 1% chance of hitting the slow tail. The chance that none of them hit it is 0.99^100, which is about 37%. So the chance that at least one does is roughly 63%. A "rare" 1-in-100 event just became the likely outcome for the overall request, purely because of fan-out. This is the main reason tail latency gets worse, not better, as systems get more distributed.
What causes the tail in practice
None of this is exotic. Garbage collection pauses, cache misses, lock contention from a noisy neighbour on shared infrastructure, a connection pool running dry, retries queuing up behind other retries - these are the default behaviour of real systems under load, not edge cases. If you've operated anything at scale you've seen the tail get long for one of these reasons, usually at the worst possible time.
The interview tell
A candidate who says "what's our p99 target" instead of "what's the average latency" is signalling something real: that they've been paged for a system that was slow for 1% of users while every dashboard showing the mean looked fine. It's a small phrase, but it does a lot of the same work as saying "restore service first" in a failure scenario - it shows the interviewer you're reasoning about the system as it's actually experienced, not as it looks on a summary chart.
What to actually do about it
Set timeouts and budgets based on the percentile that matters for the experience, not the average. Consider hedged requests - firing a second attempt if the first hasn't returned within your p50, and taking whichever comes back first - to cut off the tail before it reaches the user. Isolate slow dependencies so one component's bad day doesn't fan out into everyone else's. And measure the percentile you care about directly; a dashboard built entirely on averages will never show you the tail, because averaging is precisely how you make a tail disappear.
None of this means the average is useless - it's a fine number for capacity planning. It's just the wrong number for describing what any individual user experiences, and system design interviews that involve any real scale are, underneath the surface, usually asking whether you know the difference.